
Measure What MakesGrowth Sustainable
Growth alone is not the goal. The question for every executive team is whether growth is efficient, repeatable, and worth funding.
The right metrics reveal the health of your go-to-market system—not just whether revenue went up last quarter. They show where growth is coming from, what it costs to create, whether customers stay and expand, and where the business needs to act next.
Six Metrics That Reveal Whether Growth Can Scale
Topline growth can hide a business that is becoming less focused, less efficient, and harder to scale. For recurring-revenue businesses, these six metrics provide an executive-level view of growth quality.
Burn Multiple
If this is too high, growth is becoming unfinanceable. Burn Multiple shows whether the company is converting investment into durable new revenue—or simply spending more to maintain momentum.
CAC Payback
Fast growth with slow payback creates cash pressure even when revenue is rising. The key question is whether the company recovers its acquisition cost before the customer relationship ends or materially degrades.
Gross Revenue Retention (GRR)
GRR shows whether the core business is structurally sound or quietly leaking. If customers do not retain, new-logo growth must work harder just to keep the business moving forward.
Net Revenue Retention (NRR)
NRR reveals whether customers are becoming more valuable through adoption, renewals, and expansion—or whether growth depends on continually replacing and acquiring new revenue.
Revenue Quality by Motion, Segment & Geography
Not all growth is equal. This view shows which GTM motions, customer segments, products, and geographies deserve additional investment—and which are creating revenue without sufficient return.
Revenue per Employee
Revenue per employee shows whether headcount growth is creating leverage or simply increasing cost and complexity. It is a useful signal of whether the operating model can scale with the business.
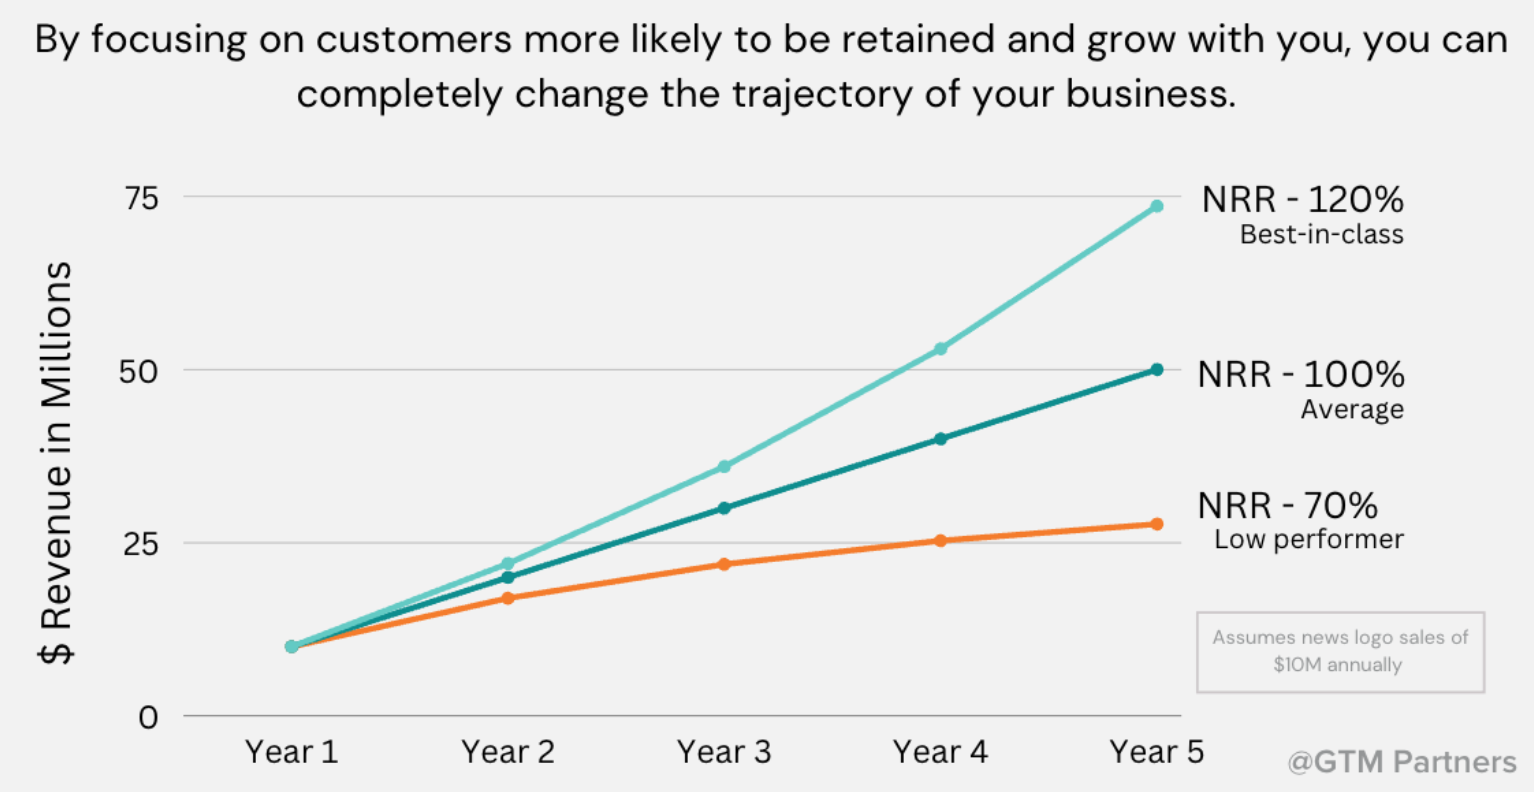
“When these metrics are weak, topline growth can mask a business that is becoming less efficient, less durable, and harder to scale.”
Sustainable Growth Is Not Just a SaaS Question
SaaS companies and non-SaaS B2B companies use different formulas. But the executive questions are the same:
For B2B companies with services, projects, repeat orders, physical products, or hybrid revenue models, recurring-revenue metrics such as ARR, GRR, and NRR do not always apply directly.
The focus shifts from subscription performance to revenue quality, repeat behavior, acquisition economics, and concentration risk.
The Core Metrics for Non-SaaS B2B Growth
Revenue Quality
Revenue Growth Rate
Revenue growth matters—but never on its own. Growth should be evaluated alongside margin, customer mix, repeat behavior, and the source of growth: price, volume, offering mix, one-time projects, or returning customers.
Gross Margin by Offering
Blended gross margin can hide where a business is creating value and where it is not. This measure shows which service lines, products, or offerings produce profitable growth—and which are consuming capacity without sufficient return.
Contribution Margin
Contribution margin shows what remains after the direct variable costs required to acquire and deliver revenue. It helps leadership distinguish between scaling revenue and scaling real economic value.
Retention & Repeat Behavior
ECRR — Existing Customer Revenue Retention
ECRR measures whether revenue from the prior-year customer base holds, shrinks, or expands in the following year—excluding new-logo revenue. It is a useful non-SaaS analogue to NRR because it shows whether existing customer relationships generate enough repeat and expansion revenue to offset declines and reduce dependence on new bookings.
Repeat Revenue Rate
Repeat Revenue Rate measures how much total revenue comes from existing or returning customers. A high rate signals greater predictability, lower acquisition cost per dollar of revenue, and a more durable customer base. A low rate means the company must constantly acquire new logos just to sustain its topline.
Revenue Grading Distribution (Grades A, B, C)
Deep Dive in Pillar 5 →Revenue Grading evaluates total ARR and logo count across three tiers: Grade A (Renew & Expand), Grade B (Renew Only), and Grade C (At Risk). A healthy portfolio concentrates 80%+ of revenue in Grades A and B, protecting Gross Revenue Retention (GRR) and powering 120%+ Net Revenue Retention (NRR).
Acquisition Economics
Customer Acquisition Cost (CAC)
CAC measures the cost to acquire a new customer. It must be evaluated against gross or contribution margin and the revenue a customer is likely to generate over the full relationship.
LTV/CAC
LTV/CAC compares total customer value to the cost of acquisition. The right threshold depends on margin, retention, and business model, but the purpose is the same: determine whether customer economics justify continued investment in acquisition.
CAC Payback
CAC Payback measures how quickly the business recovers its acquisition cost through gross or contribution profit. The key question is whether payback happens before the customer relationship ends or becomes inactive.
Risk & Concentration
Customer Concentration
A company can show healthy growth, margins, and customer economics while still carrying substantial risk if too much revenue depends on a small number of accounts. Customer concentration reveals whether revenue is broadly durable—or vulnerable to the loss, reduction, or delayed renewal of one major relationship.
“No metric should be graded in isolation. Healthy non-SaaS growth is revenue growth with margin quality, repeat customer behavior, sound acquisition economics, and manageable account risk.”
Metrics Must Match the Business You Are Building
There is no universal dashboard. The right metrics depend on the company’s business model, maturity, growth motion, and strategic priorities.
Problem-Market Fit Stage
Needs enough signal to learn: activity, engagement, opportunities, bookings, win rate, conversion, and early evidence of customer value.
Product-Market Fit Stage
Needs to understand what is repeatable in its best segments: pipeline coverage, deal velocity, average deal size, acquisition cost, margin quality, retention or repeat revenue, and performance by ICP.
Platform-Market Fit Stage
Needs to manage durable economics across customers, products, offerings, and cohorts: time-to-value, adoption, expansion, ECRR or NRR, repeat revenue, margin quality, revenue efficiency, and customer concentration.
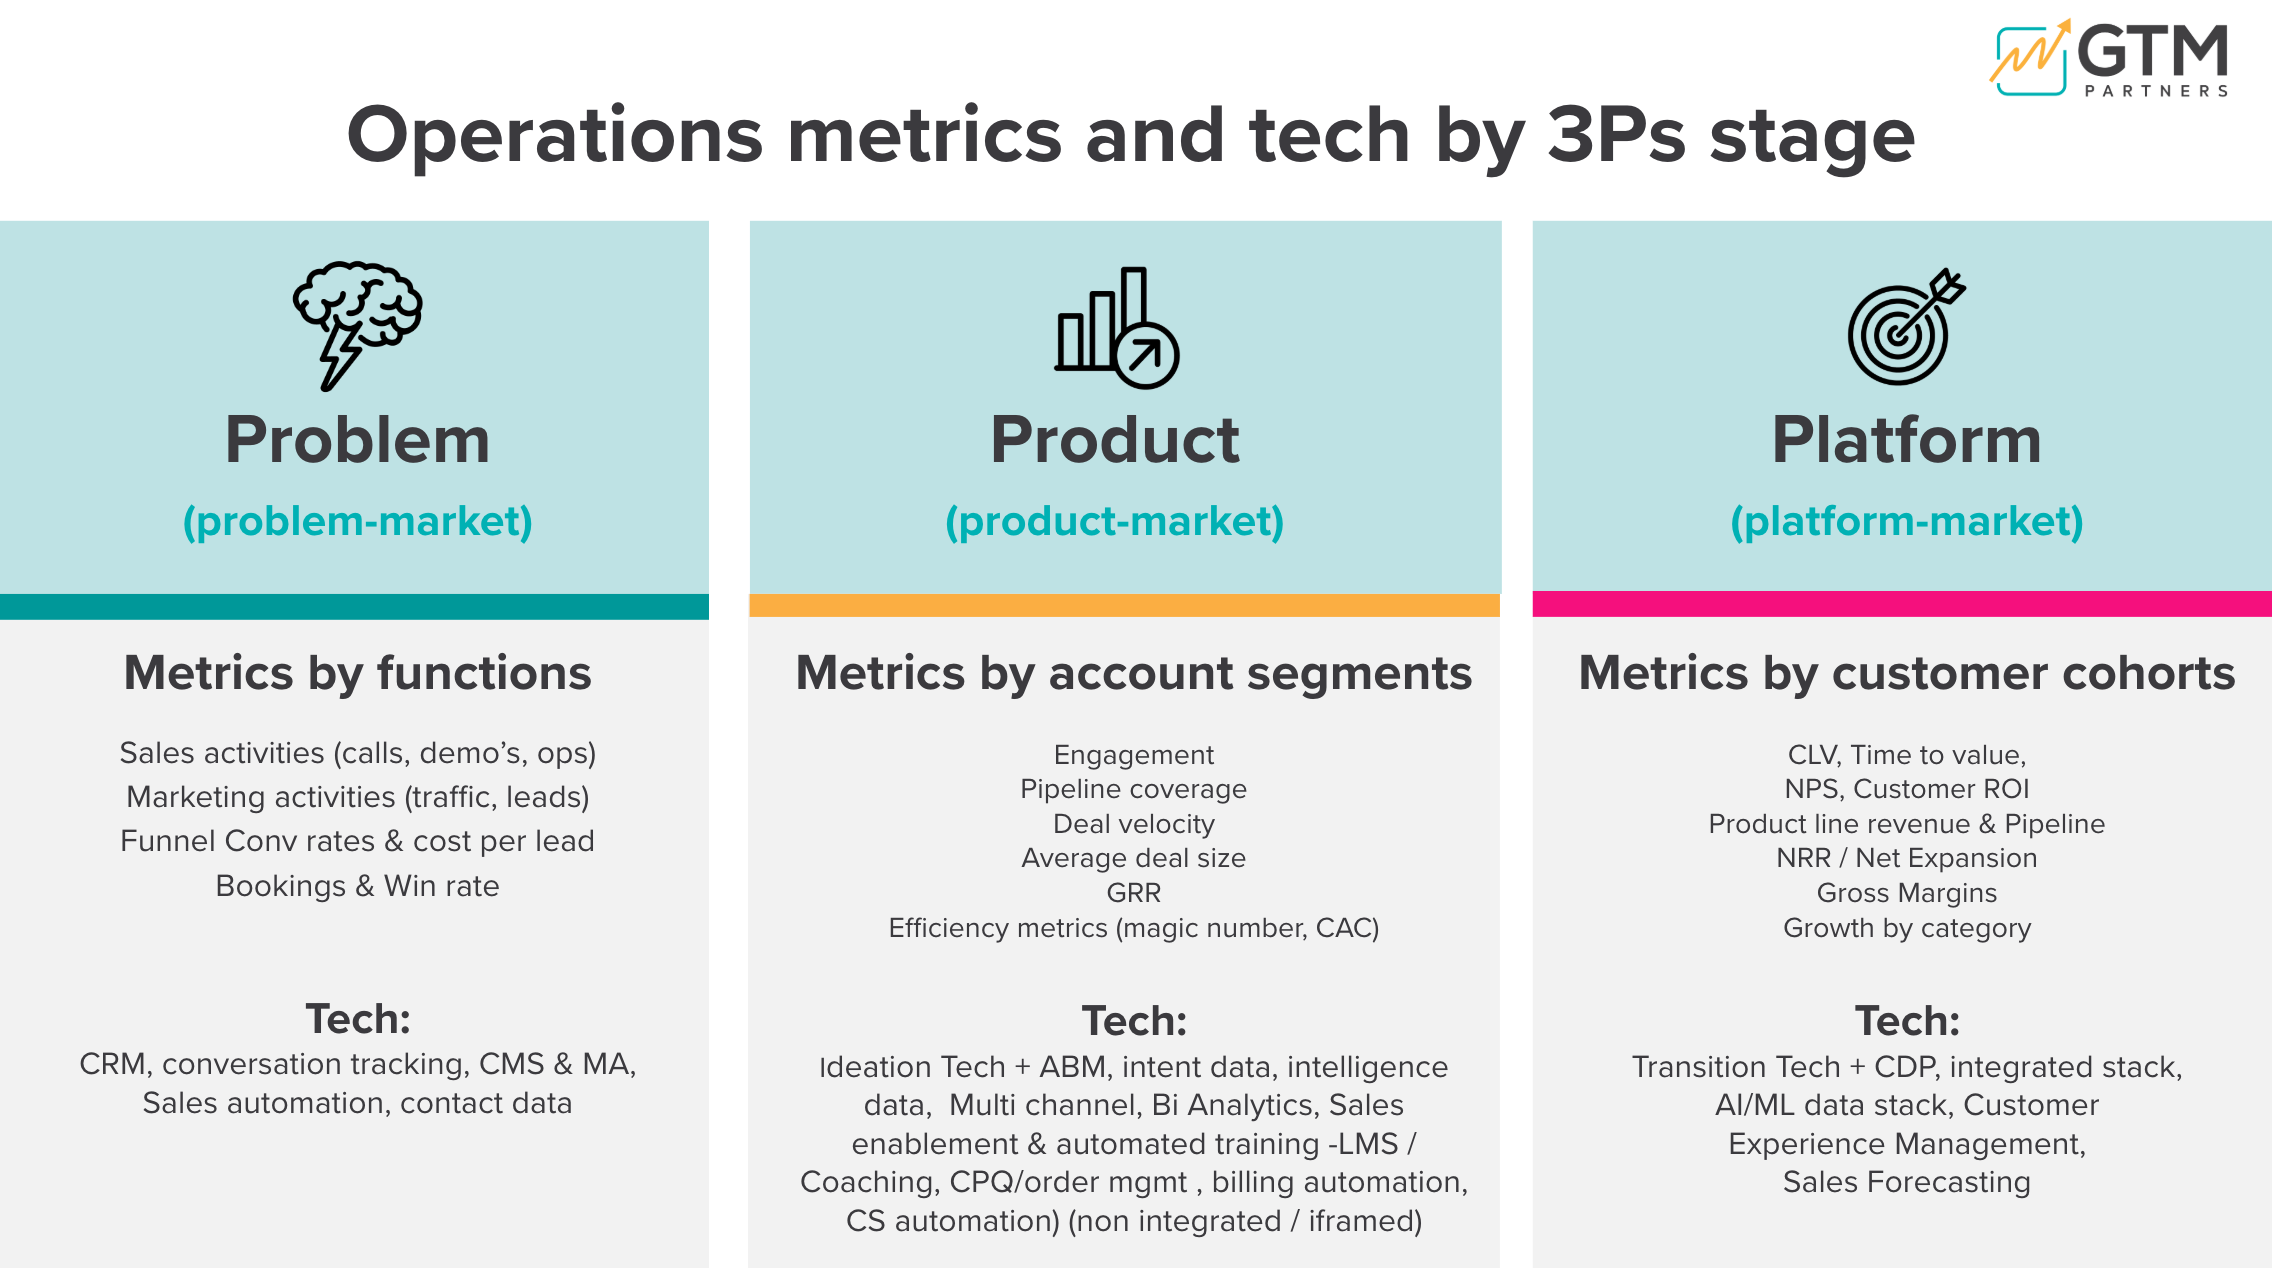
The mistake is not tracking too few metrics. The mistake is tracking metrics that do not help the executive team make better decisions at its current stage.
Move From Department Dashboards to GTM Health
Most companies have marketing dashboards, sales dashboards, finance dashboards, product dashboards, and customer success dashboards. Few have a shared view of go-to-market health.
That gap creates predictable problems: leaders debate whose numbers are right, teams optimize for departmental goals, and executive meetings become reporting sessions instead of decision-making sessions.
The 5 Questions a GTM Executive Scorecard Must Answer:
- Is our growth healthy?
- Where is our revenue engine breaking down?
- Which markets, offerings, segments, and motions deserve more investment?
- Are customers becoming more valuable over time?
- What decision do we need to make now?
From Growth Metrics to a GTM Operating Scorecard
The metrics above help leadership assess the overall quality of growth: its efficiency, durability, margin profile, repeatability, and risk.
But when a number moves in the wrong direction, executive teams need a second view: where in the go-to-market system is the issue actually coming from?
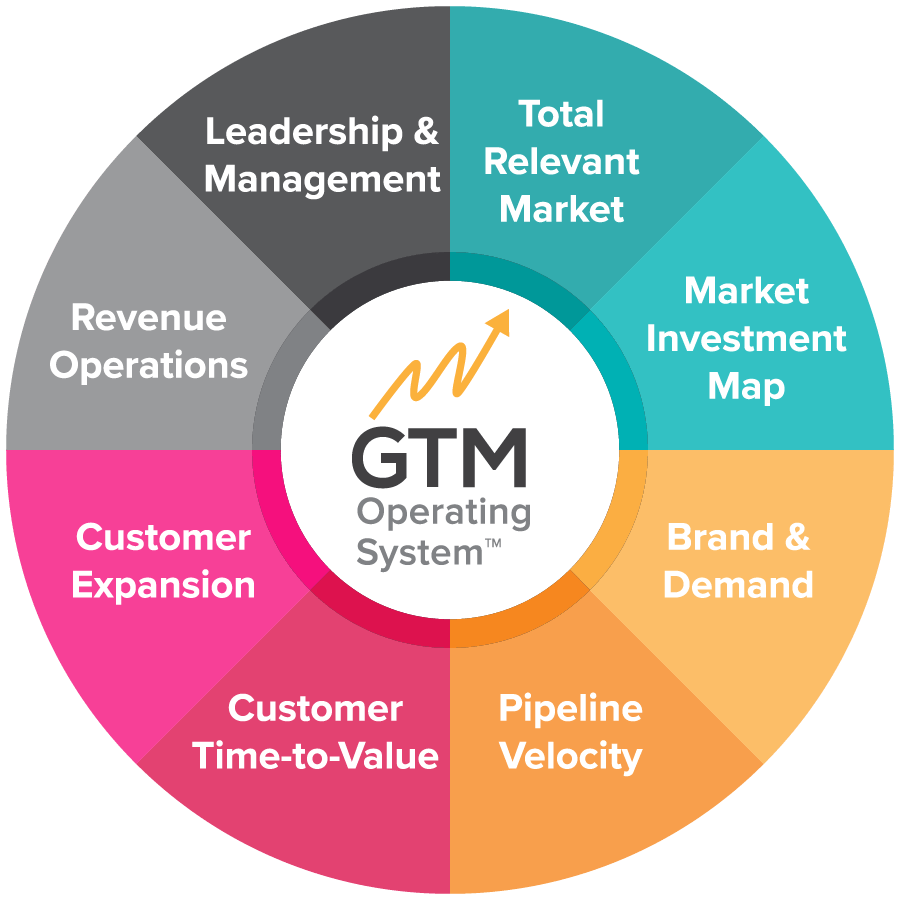
The GTM Operating System organizes that view across eight pillars. Each pillar has a primary metric that gives the executive team a clear signal of health—while allowing the supporting metrics to reflect the company’s business model.
Together, these measures move the conversation beyond, “Did we hit the number?” to:
The goal is not eight more dashboards. It is one shared scorecard that connects the health of the GTM system to the quality of business growth.
The GTM Executive Scorecard: Metrics Across the Eight Pillars
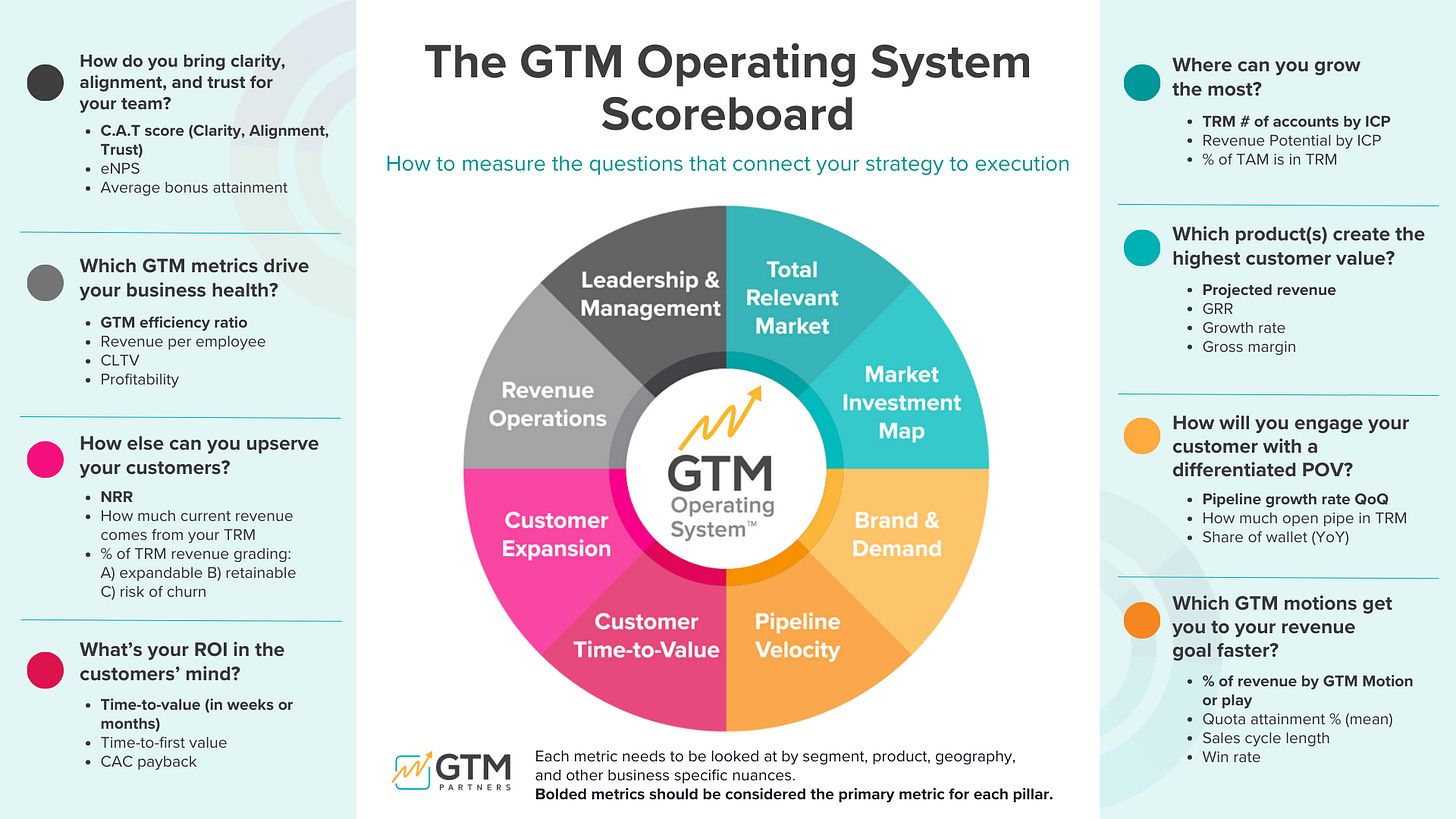
Total Relevant Market
Supporting measures may include percentage of TAM represented in the TRM and revenue potential by ICP.
Market Investment Map
Supporting measures may include growth rate, gross margin by offering, retention, and contribution margin.
Brand & Demand
Supporting measures may include organic growth, in-ICP engagement, share of wallet, search lift, and pipeline created by motion.
Pipeline Velocity
Supporting measures may include win rate, sales cycle length, quota attainment, conversion, and pipeline by motion, segment, or geography.
Customer Time-to-Value
Supporting measures may include time-to-full value, implementation time, adoption, customer ROI, and CAC Payback.
Customer Expansion
For recurring-revenue businesses, this is typically measured through Net Revenue Retention. For project, service, repeat-order, and hybrid businesses, use Existing Customer Revenue Retention and Repeat Revenue Rate. Supporting measures may include revenue from target accounts, expansion versus churn mix, repeat revenue, and customer concentration.
Revenue Operations
Supporting measures may include revenue per employee, CAC, LTV/CAC, CAC Payback, profitability, gross margin, and contribution margin.
Leadership & Management
Supporting measures may include eNPS and 90-day sprint execution velocity.
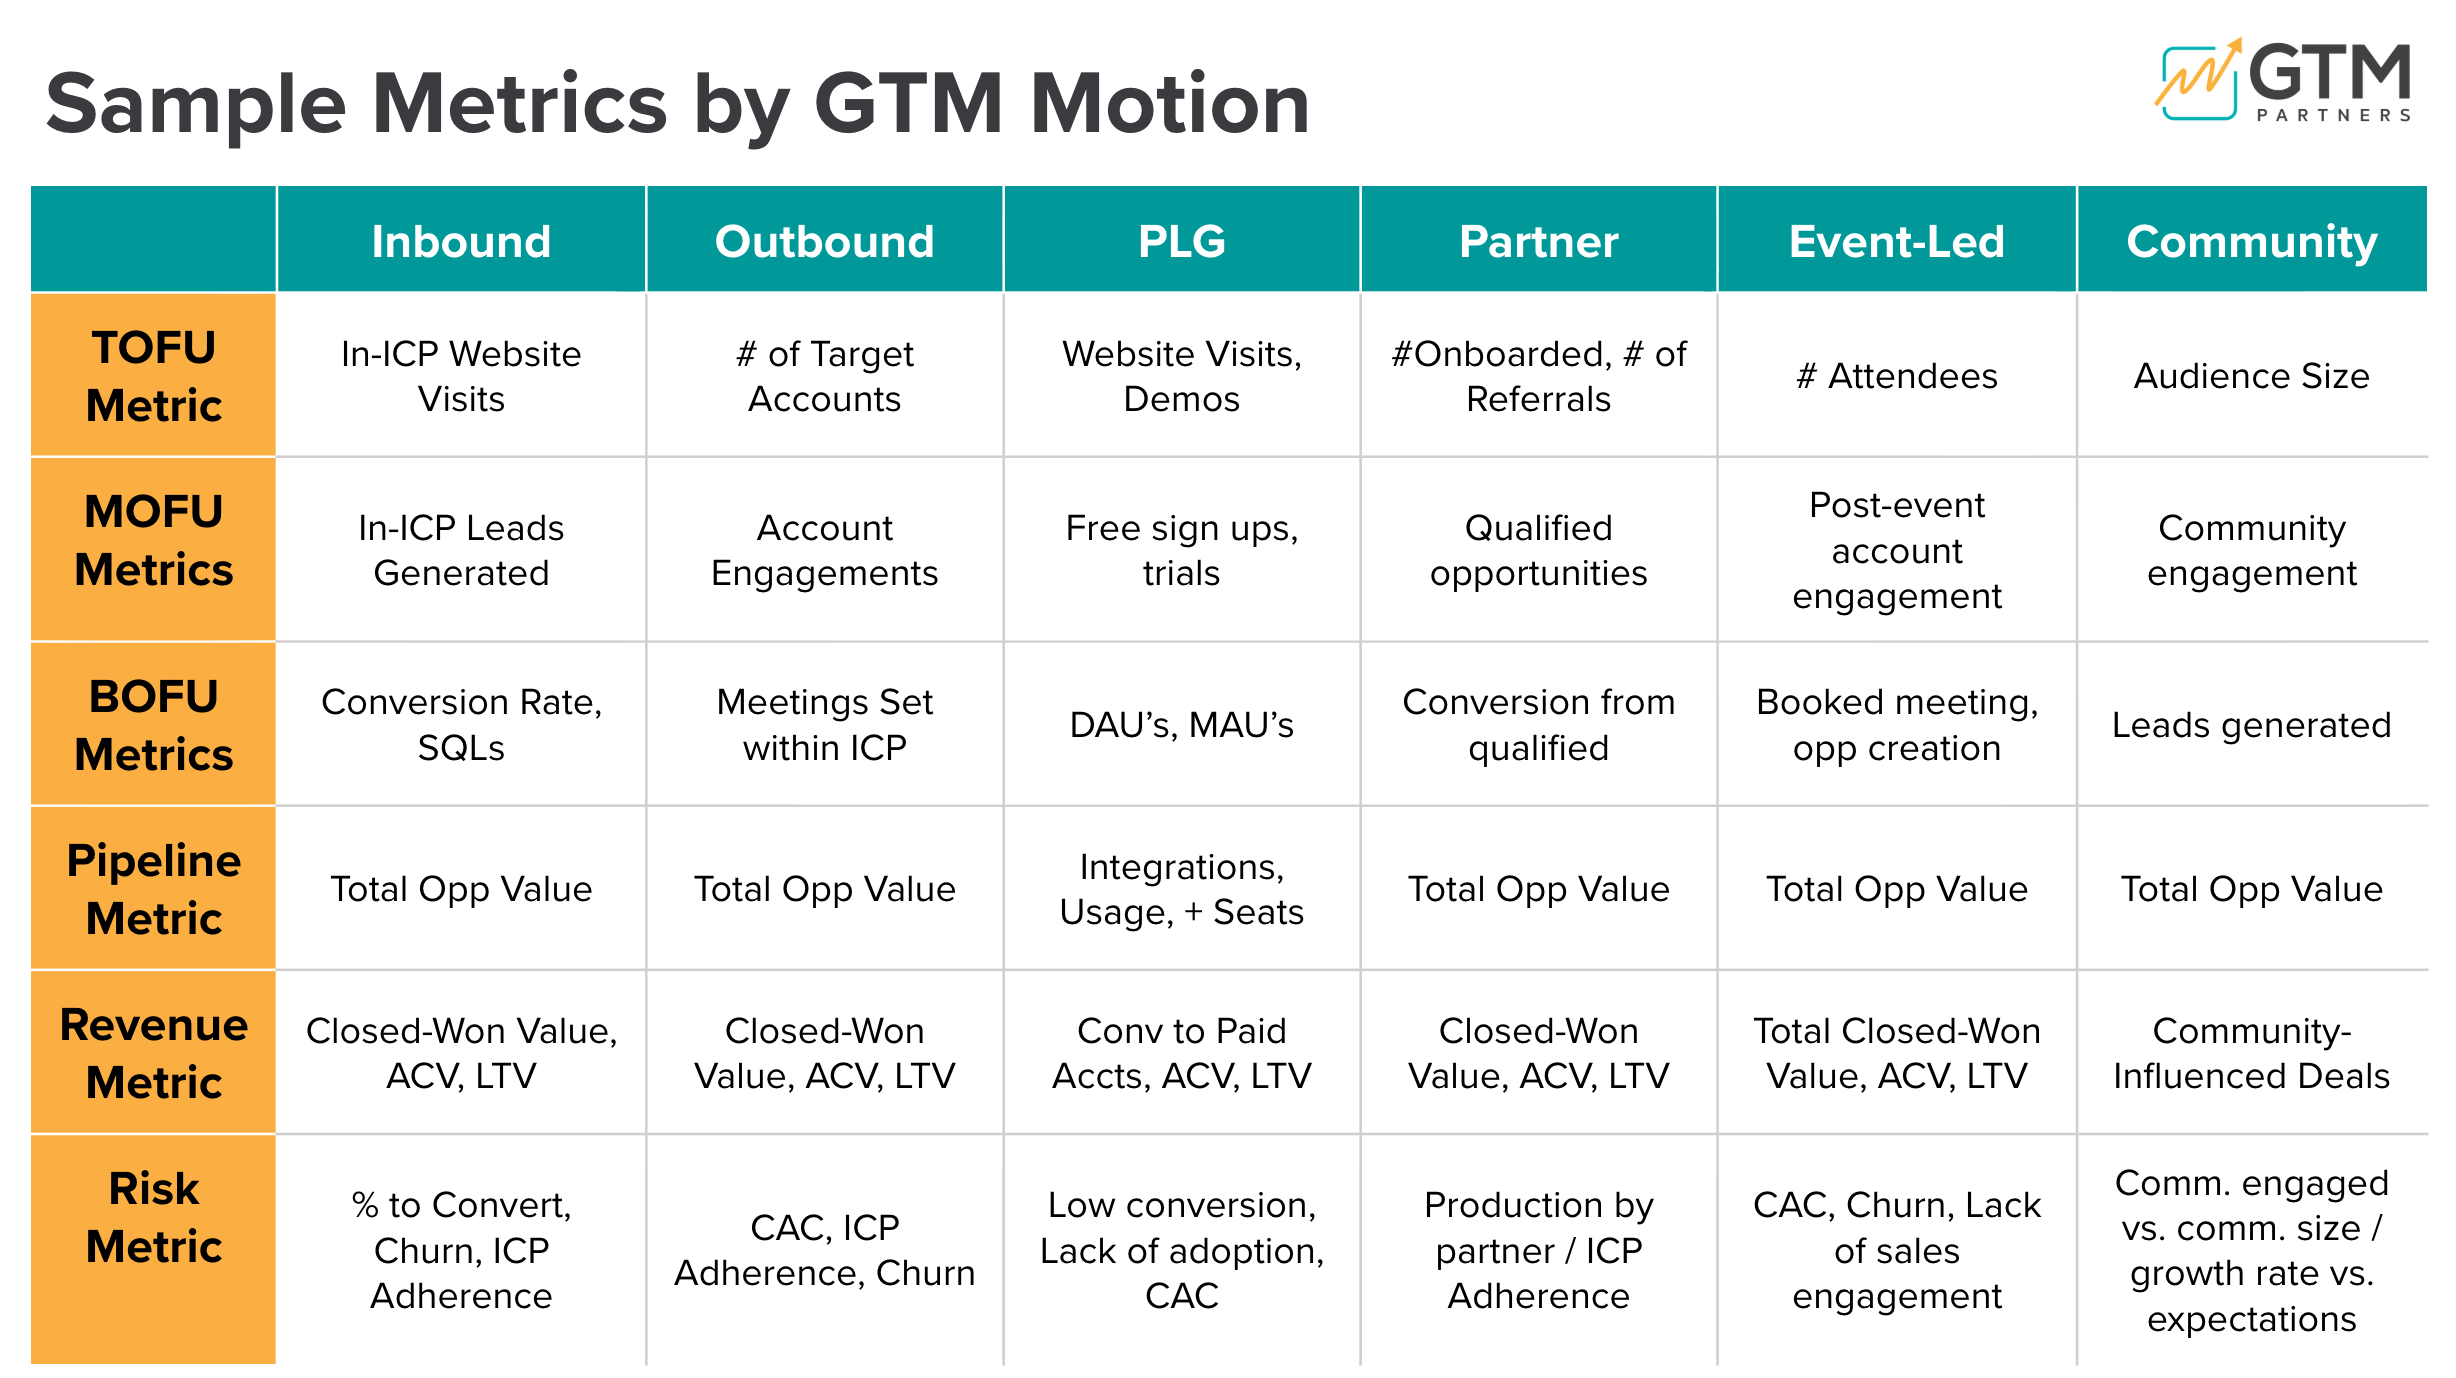
Revenue Operations: Build Your GTM Executive Scorecard
Revenue Operations is the analytical foundation of the GTM Operating System™. A Certified GTM OS Partner can help your executive team define the role and operating model of RevOps, select the company-health and pillar-level metrics that best represent GTM health, and create an operating rhythm for reviewing those metrics consistently.
This is not primarily a dashboard-implementation project. It is an executive alignment and operating-model engagement designed to help the company decide what should be measured, why it matters, who owns it, and how leaders will use it to run the business.
Want the Exact Formulas?
See the complete calculation guide for SaaS and non-SaaS B2B metrics, including Burn Multiple, CAC Payback, GRR, NRR, ECRR, LTV/CAC, margins, revenue concentration, and required definition decisions.
Measure the System. Improve the Outcome.
A Certified GTM OS Partner can help your executive team select the metrics that best represent GTM health, establish shared definitions, and build the operating rhythm for using those metrics consistently.