Market Investment MapWhich product(s) create the highest customer value?
A CEO’s guide to aligning product capabilities with target segments, eliminating margin drag, and deciding where to focus capital, engineering, and sales resources.
 GTM OS™ Framework
As B2B companies grow, they almost always accumulate products, service offerings, and add-on modules. What started as one core product that customers loved becomes four product lines, twelve packages, and an unmanageable list of custom services.
At the same time, the company attempts to sell all of these products to every market segment they have ever entered. Marketing tries to generate demand for everything; Sales reps pick and choose what they feel like pitching; and Customer Success is left supporting edge-case implementations that destroy gross margins.
This is the classic “Peanut Butter Strategy”: spreading capital, engineering, and sales talent so thin across multiple product-market combinations that the company fails to achieve dominant product-market fit in any of them.
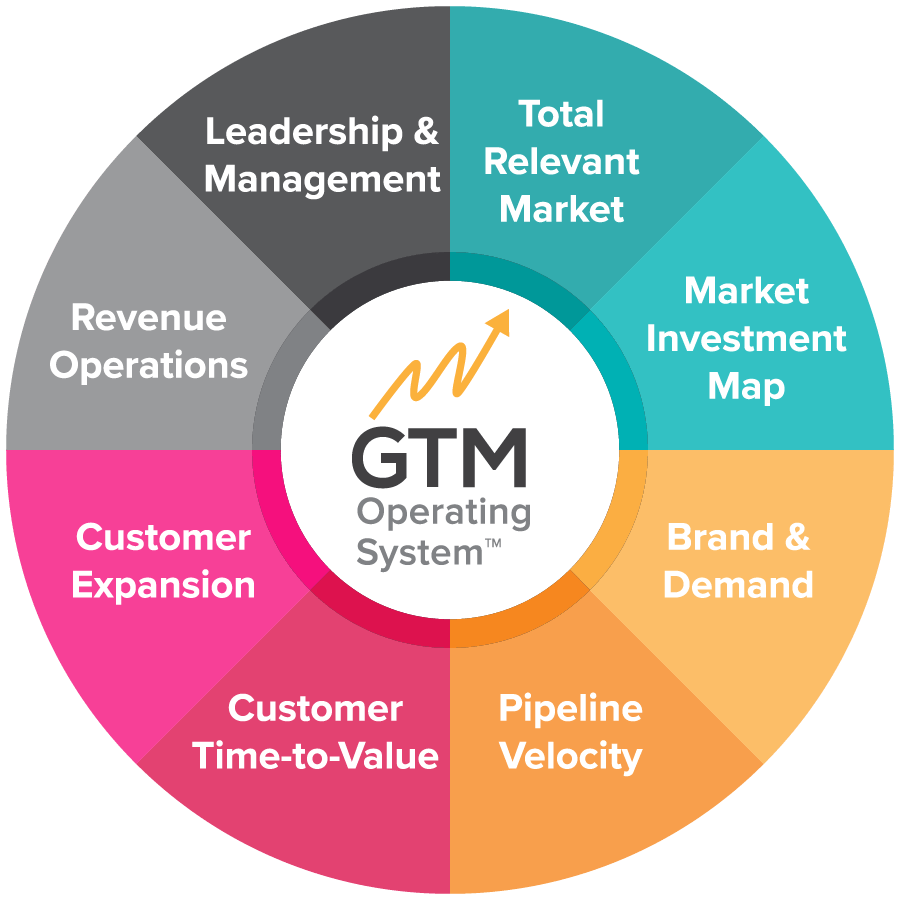
Pillar 2 of the GTM Operating System — the Market Investment Map (MIM) — is the executive tool that restores focus.
The Curse of Product Dilution
In our research studying scaling B2B enterprises, product complexity is often the silent killer of go-to-market velocity. When a company has too many offerings competing for attention:
- •Sales Cycle Bloat: Account executives spend first calls trying to figure out which of six products to pitch, confusing the buyer and delaying deal momentum.
- •Marketing Message Fragmentation: Brand positioning becomes generic because marketing must encompass multiple disparate value propositions.
- •Engineering Resource Thrash: Product roadmaps get fragmented across competing customer segments rather than compounding value in the core engine.
Once you have defined your target customer segments in Pillar 1 (Total Relevant Market), the executive team must determine: Which specific products create the highest value for each segment, and where should we place our heaviest bets?
“More products do not create more growth. Aligning your best product with your best segment is what creates compounding enterprise value.”
What Is the Market Investment Map (MIM)?
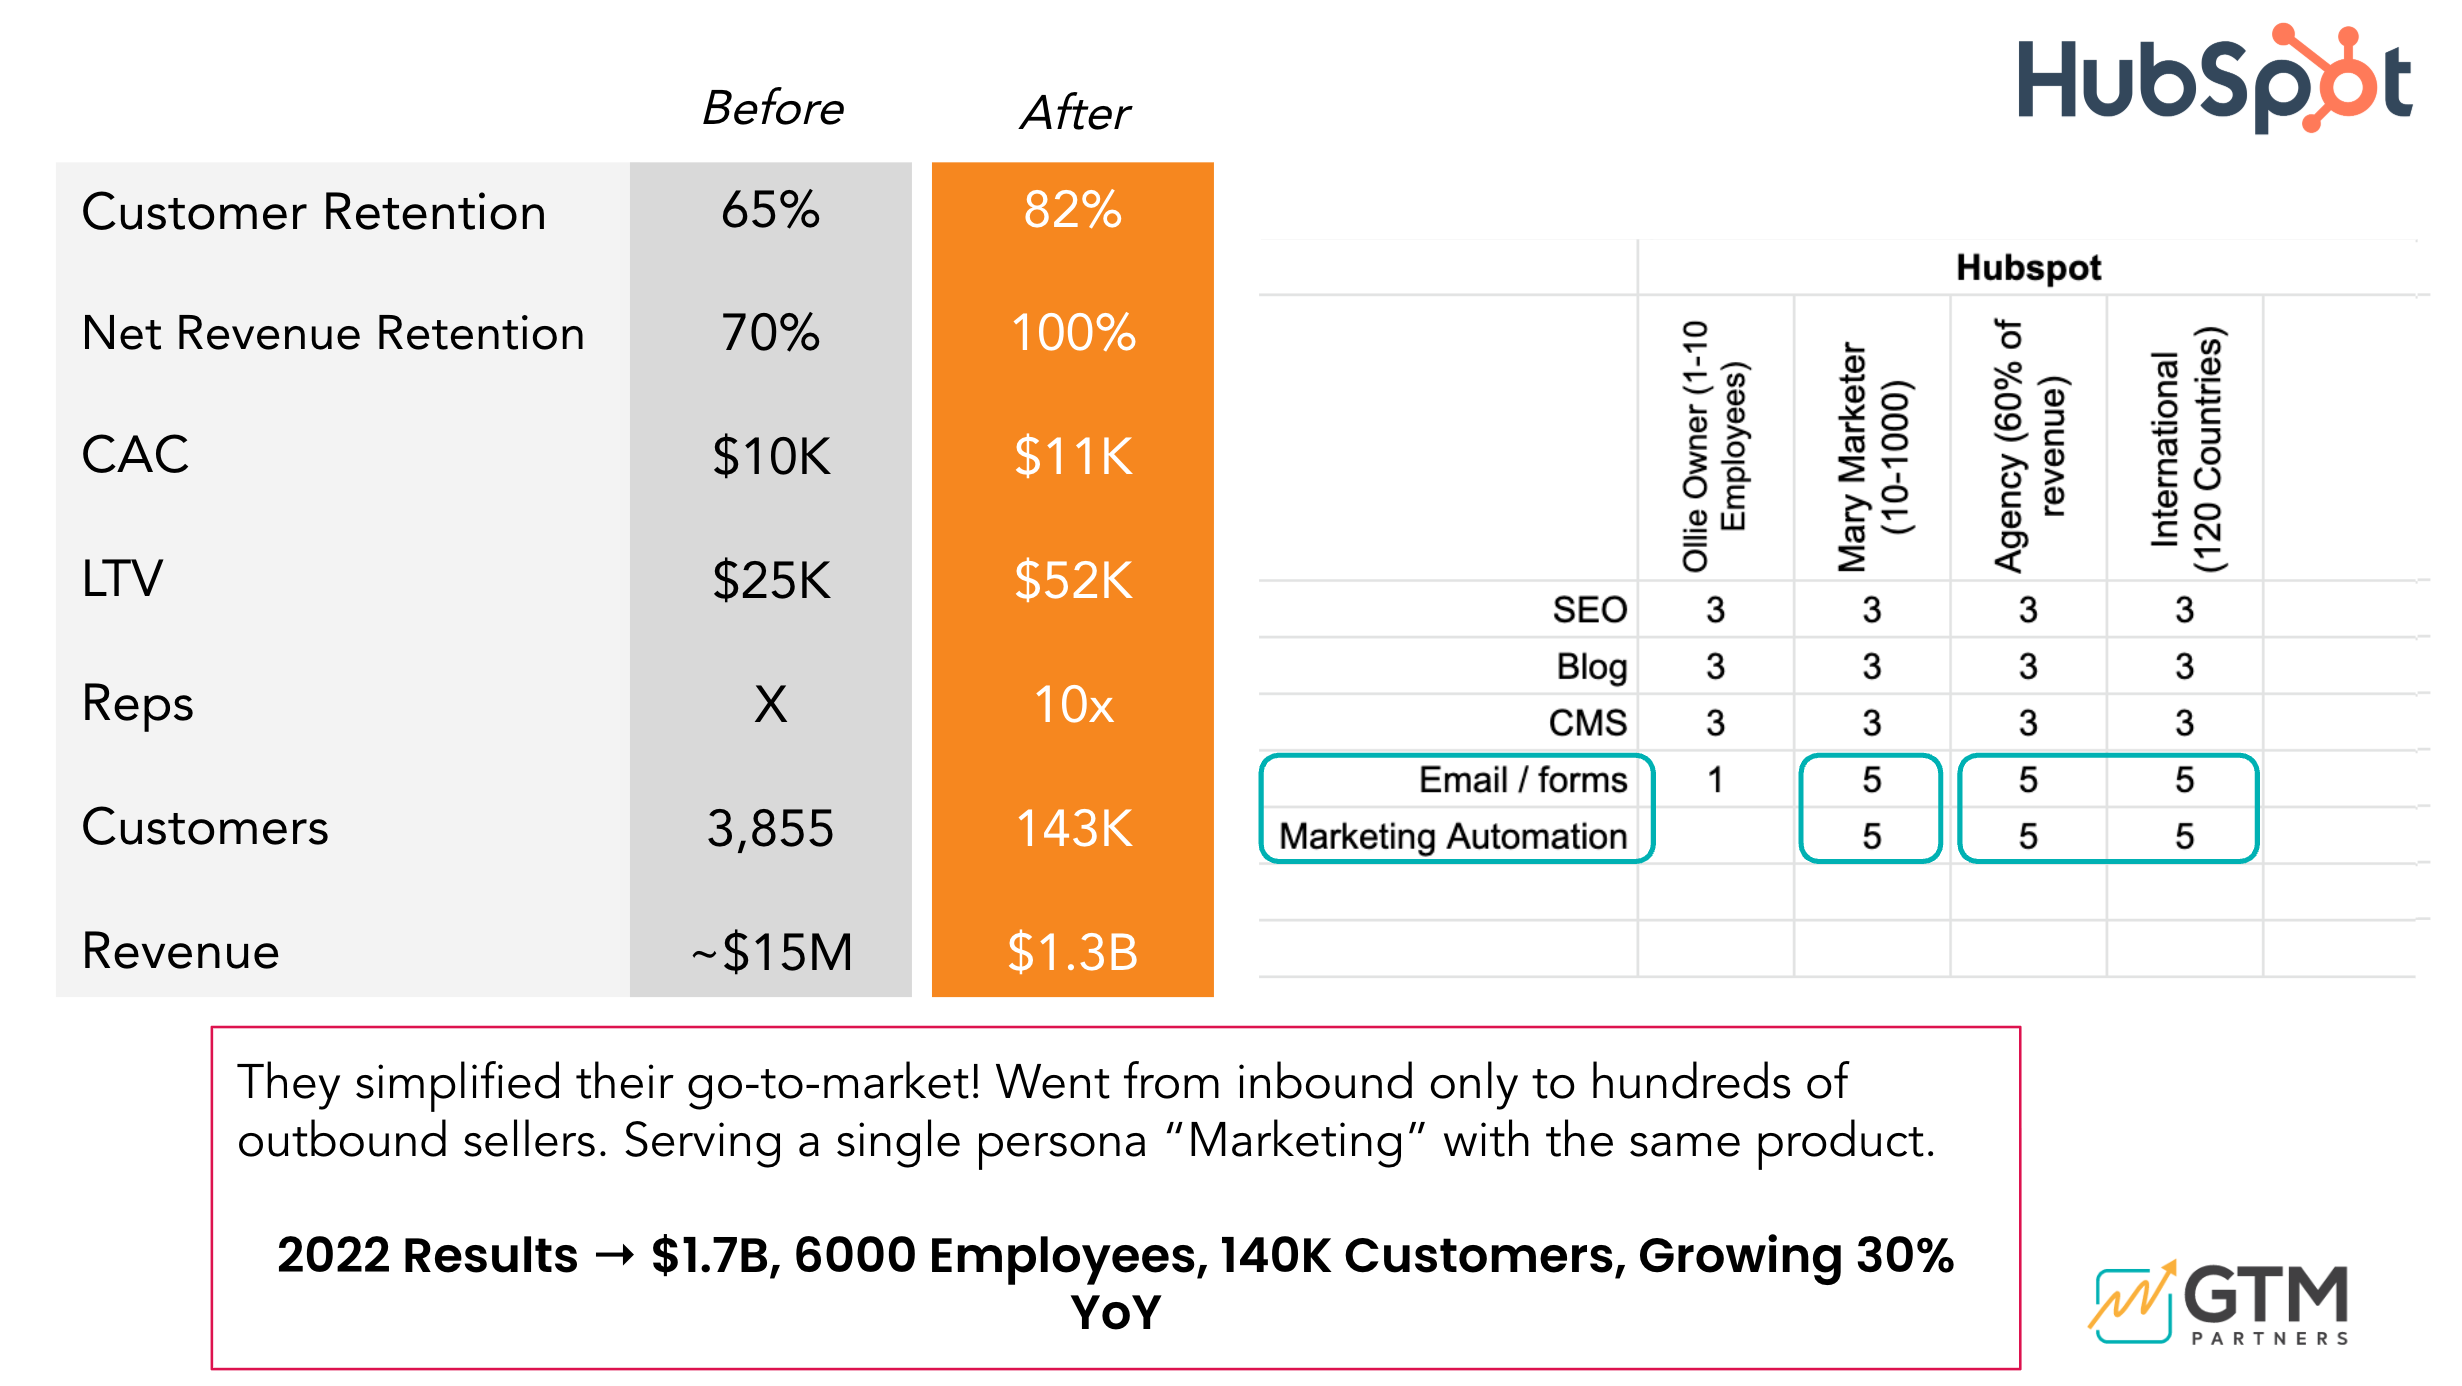
The Market Investment Map (MIM) is a visual and analytical decision matrix that maps your Target Customer Segments (Columns) against your Products, Offerings, or Capabilities (Rows).
Instead of assuming all products are equally viable across all buyers, the MIM systematically evaluates customer willingness to pay, delivery feasibility, and revenue velocity at every intersection.
How the Market Investment Matrix Is Structured:
The 1 / 3 / 5 Value Scoring Model & The Danger of “3s”
Every product × segment intersection is graded on a clear three-tier scale based on actual customer behavior and willingness to pay:
Strong Fit & High Perceived Value
The buyer urgently needs and strongly values this capability. They buy with minimal discounting, experience rapid time-to-value, and expand over time. This is where your GTM budget belongs.
Marginal Fit (The Dangerous Middle)
HIGH RISKThe buyer wants to value the solution, but it falls short. They require custom workarounds, demand steep price concessions, and burden customer support. In B2B, “3s” are far more dangerous than “1s” because they mask churn, drain gross margins, and consume executive attention.
No Fit / Not Valued
This buyer segment does not need or appreciate this offering. Clear operational signal: do not build marketing campaigns or assign sales quota here.
The Six Strategic Choices the MIM Forces
The Market Investment Map is not an academic exercise. It is a forcing function for leadership alignment that resolves six core business questions:
1. Where do we create the most value and opportunity today?
Identifies your undisputed commercial anchors — the product × segment pairings that generate high-margin revenue and sustainable customer advocacy.
2. Which combinations get us to revenue targets fastest?
Distinguishes between immediate cash-flow drivers and long-cycle opportunities, allowing RevOps to establish realistic quarterly pipeline targets.
3. What should we stop doing immediately?
Identifies products or segments that generate friction, drag down CS capacity, or drain R&D without delivering strategic return.
4. What future bets are emerging?
Surfaces emerging products or new market segments that warrant incubation and R&D investment without prematurely burdening sales quotas.
5. Which offerings can be sold and packaged together?
Provides the analytical foundation for Pricing & Packaging by identifying natural solution bundles for common customer outcomes.
6. How many distinct GTM motions does this imply?
Connects the map directly into execution by determining whether your sales team can sell these offerings using one motion or requires multiple separate engines.
Connecting Products to GTM Motion Complexity
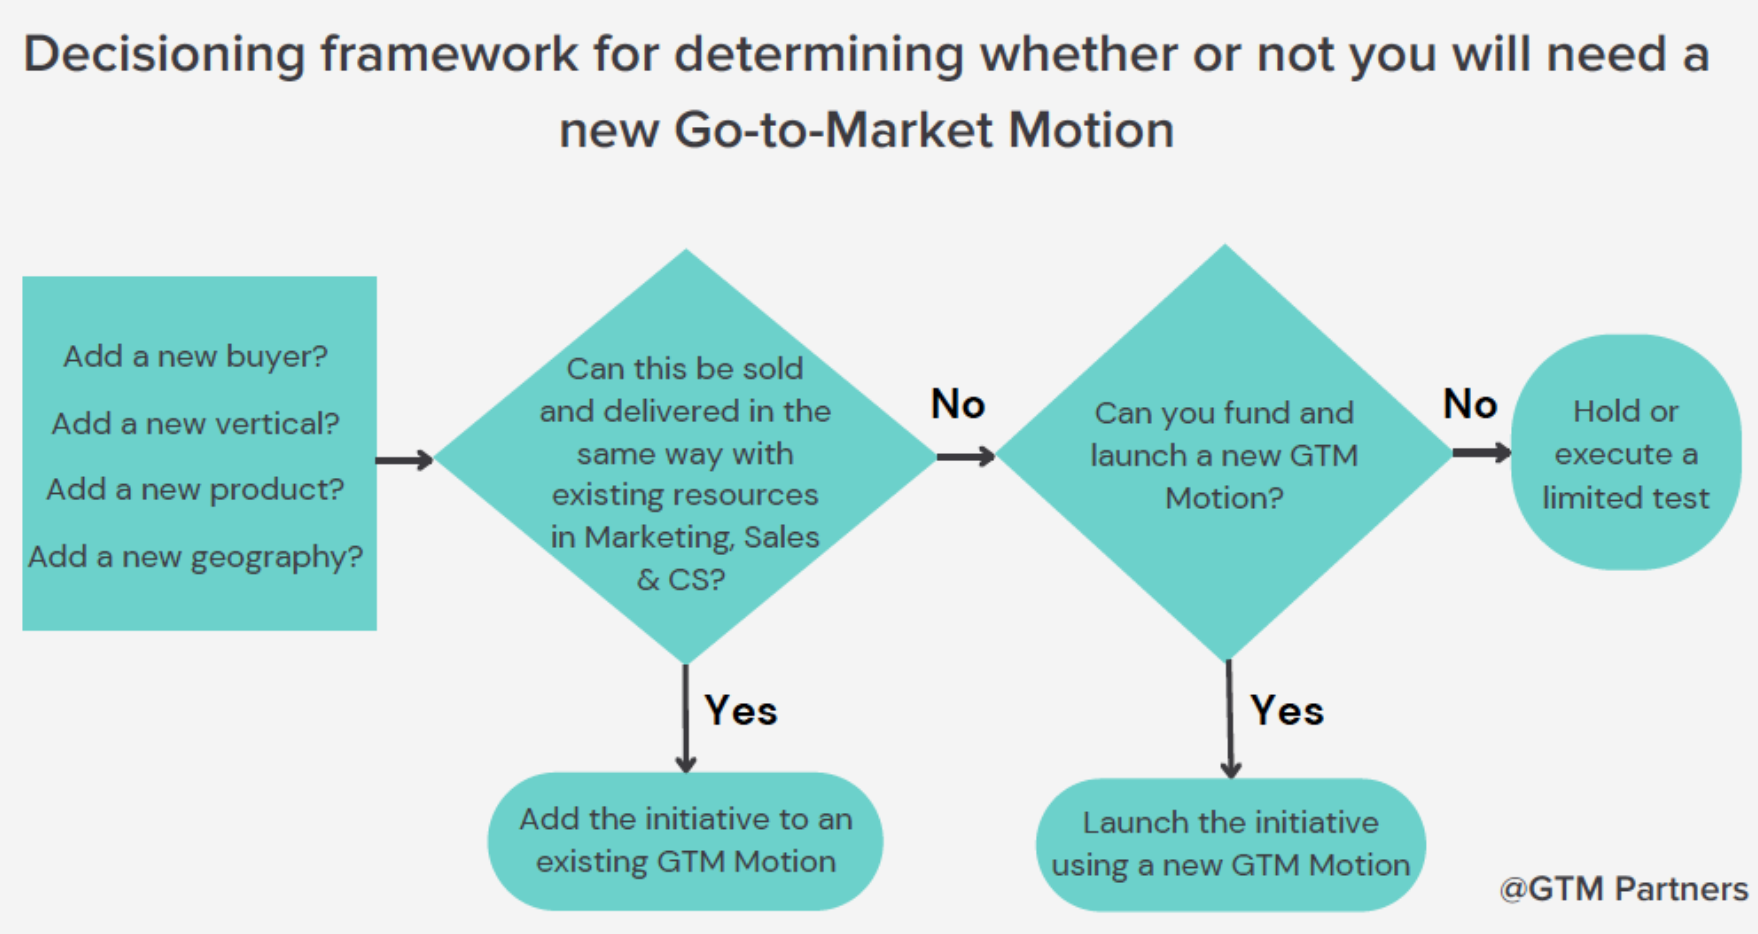
One of the most dangerous executive blind spots is assuming that once a product is built, the existing sales team can simply “add it to the bag.”
In reality, selling a new product or entering a new segment almost always introduces a new Go-to-Market Motion:
- • Selling an enterprise security add-on to Healthcare requires a high-touch Outbound-Led motion.
- • Selling a developer utility to tech startups requires a self-serve Product-Led (PLG) motion.
- • Selling through integrators and consultancies requires a Partner-Led (Ecosystem) motion.
Most mid-market companies only have the executive bandwidth and operational capital to run one or two GTM motions effectively. When the MIM reveals that your product ambitions require four distinct motions, leadership must make tough choices to consolidate and sequence.
Category Expansion: Solution Depth vs. Solution Breadth
Growth through solutions means expanding the value and footprint of your offering—not simply adding features or entering adjacent markets. This framework helps leaders examine what sits around their core category, determine what should naturally consolidate around their platform, and make smarter build, buy, or partner decisions.
“You will make smarter expansion decisions when you understand your center of gravity better than the adjacent category players around you.”
— MOVE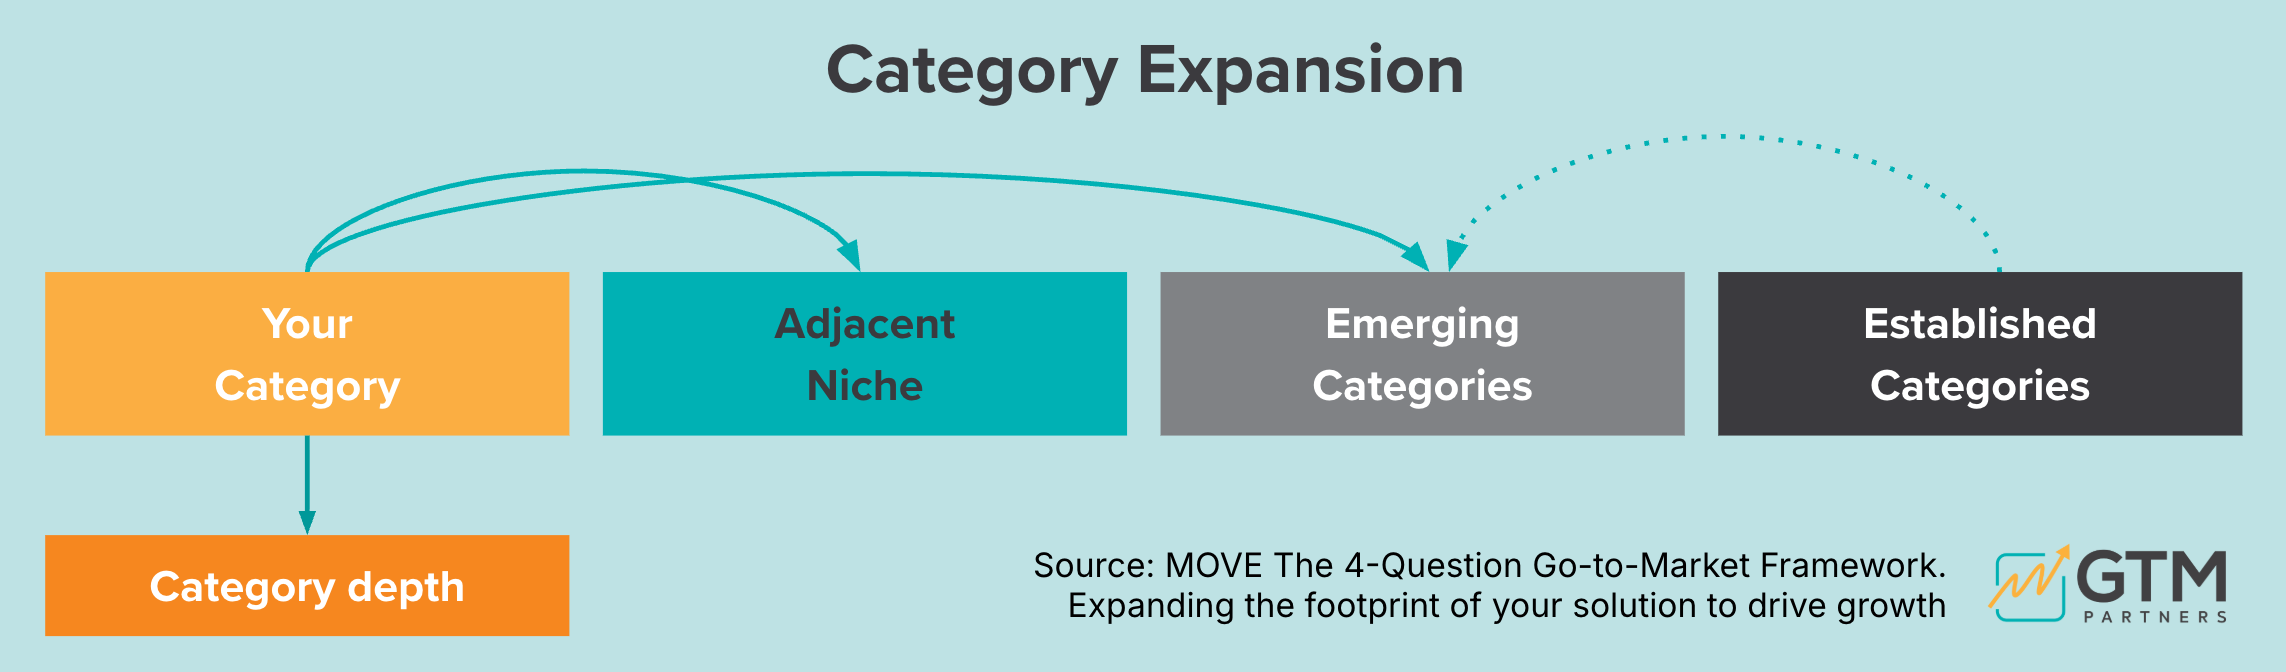
The Market Investment Map turns category expansion into an investment decision. Evaluate potential build, buy, or partner opportunities against the value buyers care about most—not simply feature adjacency or market size.
The strongest moves create clear buyer value across the map: either going deeper in the current solution by earning 5s across the horizontal capabilities buyers need, or going broader by creating a vertical path into a high-value adjacent use case, persona, or category. If the opportunity does not improve the value your best customers will recognize and pay for, it may add complexity without strengthening your platform’s center of gravity.
The M&A Playbook: Inorganic Growth & Product Expansion
How companies of all sizes leverage inorganic growth, tuck-ins, and strategic acquisitions to scale faster and smarter without diluting gross margin or creating tech debt.
The Art of Strategic Subtraction
Strategic planning is rarely about deciding what to add. True strategy is deciding what to subtract.
When leadership completes the Market Investment Map, the output is not a larger list of priorities. The map should feel lighter. It gives the CEO and executive team the objective data and conviction required to:
- • Sun-down low-margin, high-friction legacy products.
- • Stop marketing campaigns in unproven segments.
- • Concentrate top sales talent on highest-value 5-score combinations.
- • Reallocate engineering capacity to the features that drive customer expansion.
How Companies Implement the Market Investment Map
Building a Market Investment Map requires cross-functional collaboration between the CEO, Head of Product, CMO, CRO, and CFO.
Having an outside Certified GTM OS Partner facilitate the MIM working sessions ensures that internal politics, pet projects, and emotional attachments are replaced with objective diagnostic rigor.
Engage a Certified GTM OS Partner for Pillar 2 (MIM):
- • Product × Segment Mapping Sprint: Build and score your full Market Investment matrix with executive leadership.
- • Strategic Subtraction Alignment: Formally agree on what products, segments, and motions will be deprioritized.
- • Pricing & Packaging Integration: Connect highest-value product tiers to packaging and pricing redesign.
- • Revenue Motions Design: Map winning combinations directly into Pillar 4 (Pipeline Velocity Playbook).
What Executive Teams Say About the GTM OS™ Market Investment Map
Perspectives on concentrating resources on high-leverage segments and saying no to dilutive opportunities.
"One of the biggest things the process forced us to confront was focus. We had multiple directions we could pursue, but the Market Investment Map helped us step back and ask a hard question: where should we actually concentrate our energy to land and expand inside organizations. That clarity fundamentally changed how we think about growth."
"When you map segments against the capabilities they value most, you start to see where the real leverage is. That's powerful because it doesn't just shape product decisions — it influences how the entire go-to-market organization focuses."
"The biggest change coming out of the Market Investment Map was focus. For the first time, we had leadership alignment around exactly where we were going to invest and where we weren't. That level of clarity made it much easier for the entire organization to move in the same direction."
"When we started working through the Market Investment Map, it was like a weight lifted off our shoulders. We simplified the solutions and suddenly the strategy became clear — my head literally stopped hurting trying to look at everything at once."
Ready to Align Your Products with Your Best Markets?
Connect with a Certified GTM OS Partner to build your Market Investment Map, eliminate low-margin friction, and focus your entire commercial engine on your highest-value products.